OEE (Overall Equipment Effectiveness) tells you what share of your planned production time actually produced good parts at full speed. Below is the formula, a worked example from a real-style shift, the benchmarks, the mistakes that make OEE lie, and how to use it to find your biggest losses.
In short: OEE = Availability × Performance × Quality. A typical plant measuring for the first time scores 40–60%. World class is about 85%. Every point you recover is extra output with no new machines or people.
The OEE formula
OEE multiplies three factors, each a percentage:
| Factor | Formula | What it captures |
|---|---|---|
| Availability | Run time ÷ Planned production time | Breakdowns, changeovers, waiting for material or people |
| Performance | (Ideal cycle time × Total count) ÷ Run time | Slow running and small stops |
| Quality | Good count ÷ Total count | Scrap and rework |
There is also a shortcut that gives the same answer: OEE = (Good count × Ideal cycle time) ÷ Planned production time. It is simply the time you would have needed to make only the good parts at full speed, divided by the time you planned to run.
Worked example: one shift on a packing line
Here are the numbers for one day shift:
- Shift length 8 hours (480 minutes), with a 30-minute planned break → planned production time 450 minutes
- One breakdown of 45 minutes and one changeover of 25 minutes → 70 minutes of downtime
- Ideal cycle time: 1.0 minute per unit (the line’s rated speed is 60 units an hour)
- Total units made: 320, of which 16 were rejected
Step 1: Availability
Run time = 450 − 70 = 380 minutes. Availability = 380 ÷ 450 = 84.4%.
Step 2: Performance
At full speed, 320 units should take 320 × 1.0 = 320 minutes. The line actually ran for 380 minutes. Performance = 320 ÷ 380 = 84.2%.
Step 3: Quality
Good units = 320 − 16 = 304. Quality = 304 ÷ 320 = 95.0%.
Step 4: OEE
OEE = 84.4% × 84.2% × 95.0% = 67.6%. Check it with the shortcut: 304 good units × 1.0 minute ÷ 450 minutes = 67.6%.
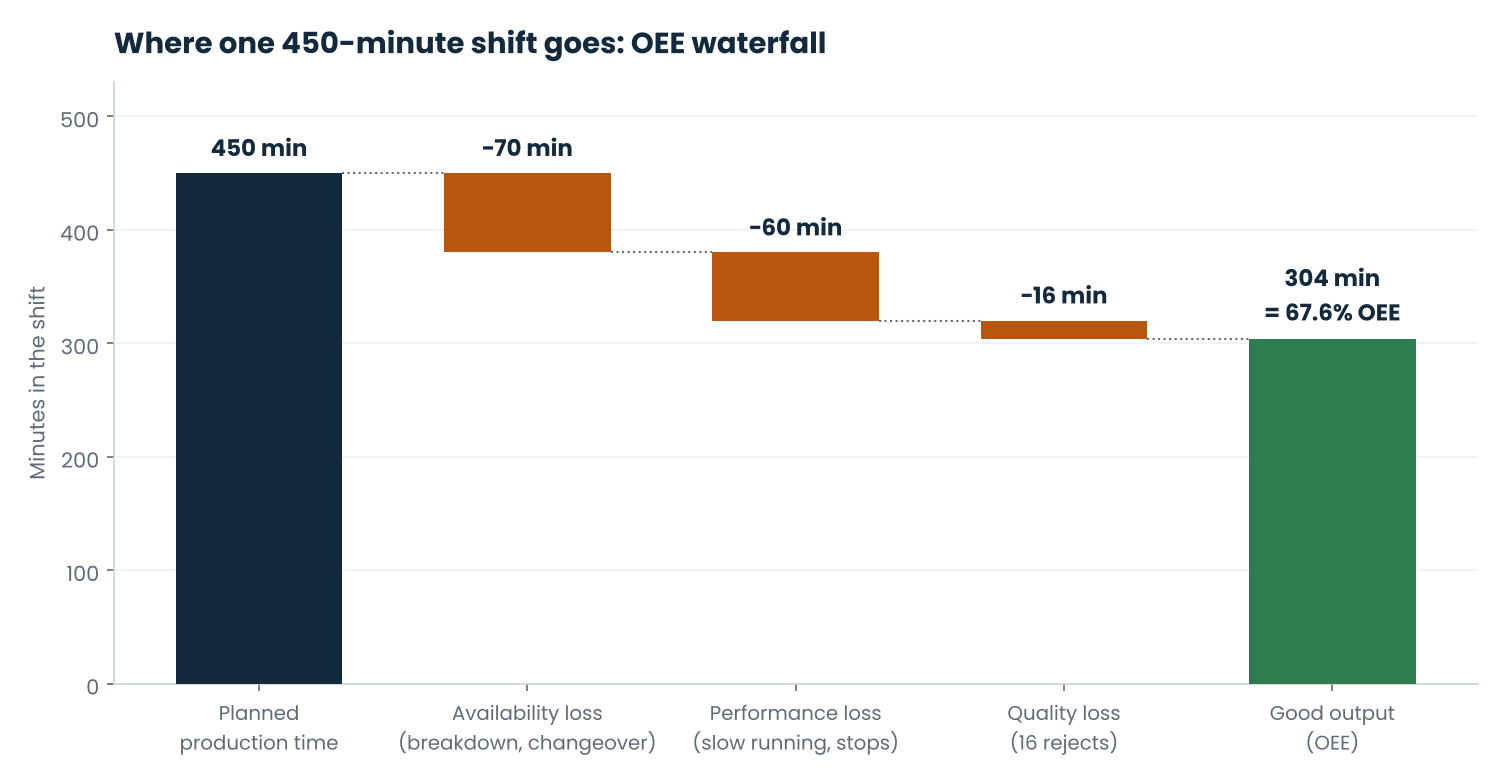
The waterfall makes the point that the percentages hide: this shift lost 146 minutes. 70 went to stoppages, 60 to slow running and small stops, and 16 to making parts that were scrapped. If each unit contributes R40 to profit, that is about R5 840 per shift, or roughly R1.3 million a year on a single line running one shift, 220 days a year.
What is a good OEE score?
| OEE | What it usually means |
|---|---|
| Below 40% | Low. Large, often unmeasured losses. Big quick wins are available. |
| 40–60% | Typical for plants measuring for the first time. |
| 60–85% | Good. Losses are being managed. |
| 85% and above | World class for discrete manufacturing. |
Compare a line with itself over time, not with another plant. Product mix, batch sizes and how you define ideal cycle time all change the number.
The Six Big Losses behind OEE
Every lost minute fits into one of six categories. Logging stoppages against these makes the next step obvious.
| OEE factor | Loss | Examples |
|---|---|---|
| Availability | Breakdowns | Motor failure, jams that need maintenance |
| Setups and changeovers | Die changes, colour changes, first-off approval | |
| Performance | Small stops | Sensor trips, blocked chutes, waiting a few minutes for material |
| Reduced speed | Running below rated speed “to be safe”, worn tooling | |
| Quality | Start-up rejects | Scrap while the process settles after a changeover |
| Production rejects | Defects and rework during steady running |
Five mistakes that make OEE lie
- Using the average cycle time as the ideal. The ideal is the rated or best demonstrated speed. Using today’s average hides all your speed losses and inflates Performance.
- Leaving changeovers out of planned time. Changeovers are a loss to be reduced, not planned time to be excluded. Only breaks, planned maintenance and “no orders” should come out.
- Not counting small stops. Stops under five minutes are rarely written down, yet they are often the biggest single loss. Check the count against the clock.
- Counting reworked parts as good. Quality is right first time. A part that was fixed is a quality loss.
- Measuring OEE and doing nothing with it. The number is only useful if someone reviews the top three losses every week and acts on them.
How to start measuring OEE this week
- Pick your bottleneck machine or line, the one that limits output.
- Agree the ideal cycle time with production and engineering, and write it down.
- Log every stop longer than two minutes on a simple sheet at the machine, with reason and duration.
- At the end of each shift, record total and good counts.
- After two weeks, rank the losses in minutes and attack the biggest one with a 5 Whys at the machine.
Put a rand value on your lost capacity
Our free Hidden Capacity Calculator turns your OEE into hours, extra shifts and rand per year in two minutes. When you are ready to track OEE shift by shift, the OEE Calculator & Six Big Losses Analyser (R590) does the maths, the Pareto and the top 3 losses for you.
Frequently asked questions
Is OEE the same as efficiency?
No. Many plants report “efficiency” as output against a target. That ignores time lost before the line starts, and the target often already includes the losses. OEE measures against the ideal, so it shows the full opportunity.
Should I measure OEE on every machine?
Start with the bottleneck. Improving a machine that is not the constraint rarely increases what you ship.
What is TEEP?
TEEP (Total Effective Equipment Performance) measures against all calendar time, 24 hours a day, 7 days a week. It shows how much capacity you could gain by adding shifts. OEE measures how well you use the time you have already planned.
Need help finding your top losses? Our Remote Diagnostic reviews your data over two weeks and gives you a costed action plan, for a fixed R7 500.

Leave a Reply